Building a temporal network
Phasik allows the user to build a temporal network from timeseries data in one of the following forms:
node time series, e.g. protein concentration over time, as a pandas Dataframe. Indices must be node names (strings or integers), and columns must be times.
edge time series, e.g. protein-protein interactions over time, as a pandas DataFrame. Indices must be edge names (e.g. ‘A-B’ for nodes ‘A’ and ‘B’), and columns must be times.
t-edges, also called timestamped interactions of the form (i,j,t,weight), as a pandas DataFrame. Columns must be ‘i’, ‘j’, ‘t’ and optionally ‘weight’. Each row represents one t-edge.
The user can choose to build a fully connected temporal network from this data, with the following methods:
|
Creates a TemporalNetwork from a dataframe of tedges |
|
Creates a TemporalNetwork from a DataFrame of edge timeseries |
|
Creates a temporal network by combining node timeseries into edge timeseries. |
Or to combine the time series data with a static network, with the following methods:
Creates a temporal network by combining a static network with tedges |
|
|
Creates a temporal network by combining a static network with edge timeseries |
|
Creates a temporal network by combining a static network with node timeseries |
Note
The set of nodes/edges present in the time series do not need to be the same as those present in the static network. In the resulting temporal network, the nodes and edges are those of the static network, and the methods only add temporal information for the edges among those present in the time series (as an edge, or as two nodes).
Note
In Phasik, timepoints do not need to be evenly spaced in a temporal network. This opens the possibility to use timeseries associated to a pseudotime for example.
Example from static network and node time series
Before anything, start by importing Phasik and a few base packages. Numpy is only used to generate random data for the example, and Maplotlib to illustrate it.
>>> import matplotlib.pyplot as plt
>>> import networkx as nx # for the static network
>>> import numpy as np
>>> import pandas as pd # for the temporal data
>>> # import Phasik
>>> import phasik as pk
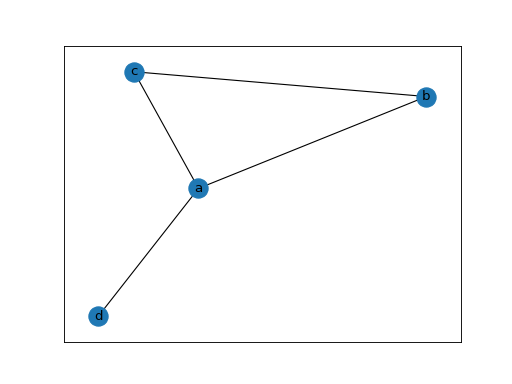
First, we generate an example static network
>>> edges = [('a', 'b'), ('a', 'c'), ('b', 'c'), ('a', 'd')]
>>> static_network = nx.Graph(edges)
>>>
>>> nx.draw_networkx(static_network)
>>> plt.show()
Note
The nodes can be either strings or integers.
Note
The static network can be created any other method provided by NetworkX. It can be created from a file containing interactions (edgelist) or and adjacency file, for example.
Second, we generate example time series for the nodes
>>> nodes = list(static_network.nodes)
>>> N = static_network.number_of_nodes()
>>> T = 10 # number of timepoints
>>>
>>> node_series_arr = np.random.random((N, T)) # random time series
>>> node_series = pd.DataFrame(node_series_arr, index=nodes)
>>> node_series
| 0 | 1 | 2 | 3 | 4 | 5 | 6 | 7 | 8 | 9 | |
|---|---|---|---|---|---|---|---|---|---|---|
| a | 0.401917 | 0.881092 | 0.127991 | 0.912639 | 0.661475 | 0.555443 | 0.256126 | 0.727078 | 0.248045 | 0.015757 |
| b | 0.852820 | 0.936582 | 0.988778 | 0.107239 | 0.126230 | 0.250864 | 0.463638 | 0.491446 | 0.369278 | 0.982625 |
| c | 0.012937 | 0.909779 | 0.865591 | 0.049600 | 0.566255 | 0.119082 | 0.581458 | 0.970764 | 0.809731 | 0.236107 |
| d | 0.655355 | 0.173176 | 0.325639 | 0.097256 | 0.452466 | 0.646218 | 0.821179 | 0.192487 | 0.783225 | 0.798528 |
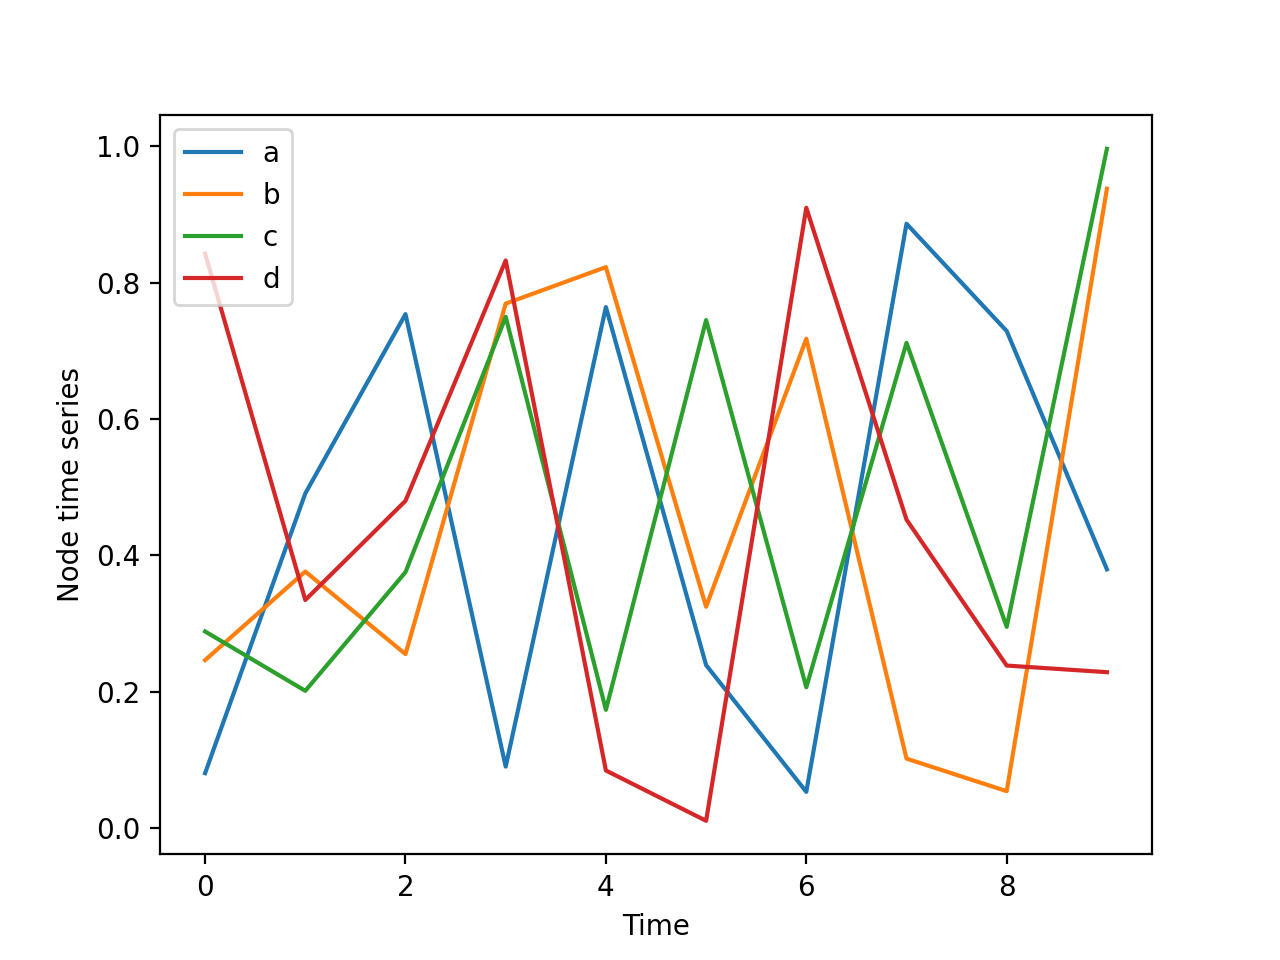
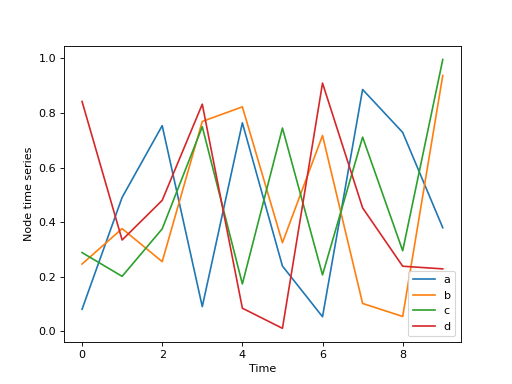
The node time series must be in DataFrame as above. The indexes represent node names, and the columns are times. Each value in the DataFrame is that relative to a given node at a given time. For example, the 1st row could could represent the concentration of protein ‘a’ from time 0 to time 9. The time series can be visualised as follows:
>>> node_series.T.plot()
>>> plt.xlabel("Time")
>>> plt.ylabel("Node time series")
>>> plt.show()
Finally, we generate the temporal network by combining the static network and the node time series. Several options are available to choose the normalisation of the resulting edge time series and how to deal with edges without temporal information.
>>> # create the temporal network by combining
>>> # the static network with the node timeseries
>>> temporal_network = pk.TemporalNetwork.from_static_network_and_node_timeseries(
...     static_network,
...     node_series,
...     static_edge_default_weight=1,
...     normalise='minmax', # method to normalise the edge weights
...     quiet=False # if True, prints less information
... )
>>> print(temporal_network)
<class 'phasik.classes.TemporalNetwork.TemporalNetwork'> with 4 nodes and 10 times
To go further
More examples of how to build a temporal network with Phasik can be found on the gitlab repository.